Top Schemes helps you find and compare mutual fund schemes. You can search for a scheme, filter by category and fund house, view returns for different periods, mark favourites, and open any scheme's factsheet for detailed information.
1. How to open Top Schemes
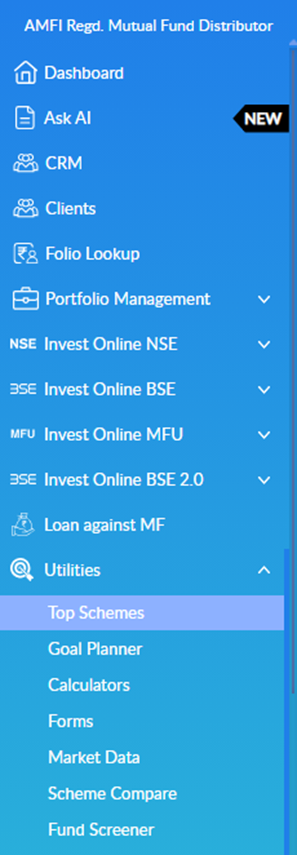
- In the left menu, click Utilities. The Utilities menu expands.
- Click Top Schemes.
2. Understanding the page
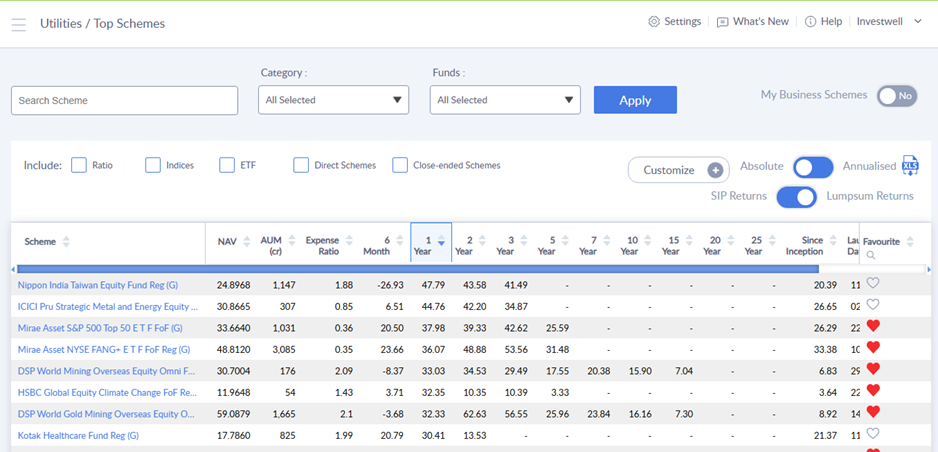
The Top Schemes page shows a table of schemes with their NAV, AUM, expense ratio and returns. The filters at the top let you narrow the list, and the options above the table change how returns are shown.
Filters at the top
- Search Scheme: type a scheme name to find it.
- Category: choose the scheme categories to show.
- Funds: choose the fund houses (AMCs) to show.
- Apply: applies the filters you have chosen.
- My Business Schemes: switch from No to Yes to limit the list to the schemes in your own business.
Options above the table
- Include: tick Ratio, Indices, ETF, Direct Schemes or Close-ended Schemes to include these in the list. They are unticked by default.
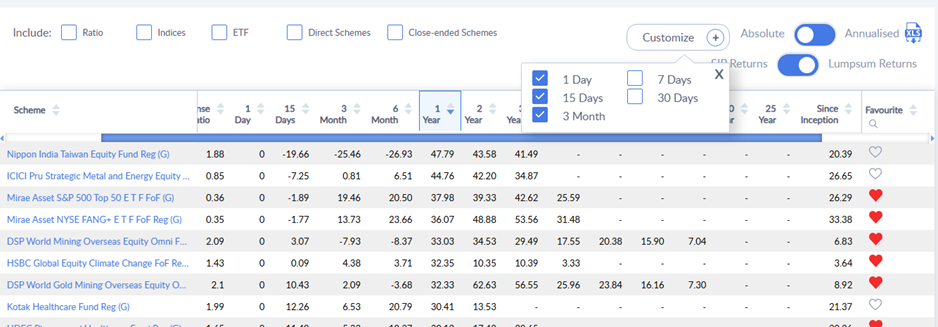
- Customize: adds shorter return periods (1 Day, 7 Days, 15 Days, 30 Days, 3 Month) as columns.
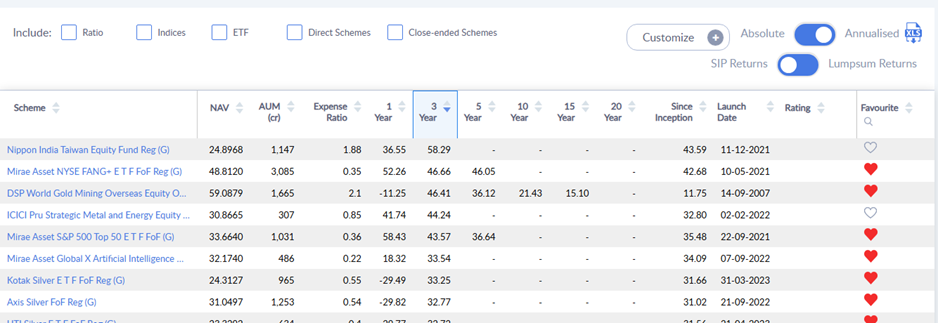
- Absolute / Annualised: switches how returns are shown.
- SIP Returns / Lumpsum Returns: switches the table between SIP returns and lumpsum returns.
- Excel (XLS) icon: downloads the table to Excel.
Columns in the table
Scheme, NAV, AUM (cr), Expense Ratio, returns for 6 Month, 1 Year, 2 Year, 3 Year, 5 Year, 7 Year, 10 Year, 15 Year, 20 Year, 25 Year and Since Inception, Launch Date, Rating and Favourite. A dash means there is no return to show for that period, for example because the scheme is newer than that period.
3. How to find schemes
Search by scheme name
- Type part of the scheme name in Search Scheme.
- Click Apply.
Filter by category
- Click the Category dropdown. All categories are ticked by default.
- Untick All and then tick the categories you want, or type in the search box inside the dropdown to find a category.
- Click the arrow beside a category (for example Debt, Equity or Hybrid) to see its sub-categories, and tick or untick them.
- Click Apply.
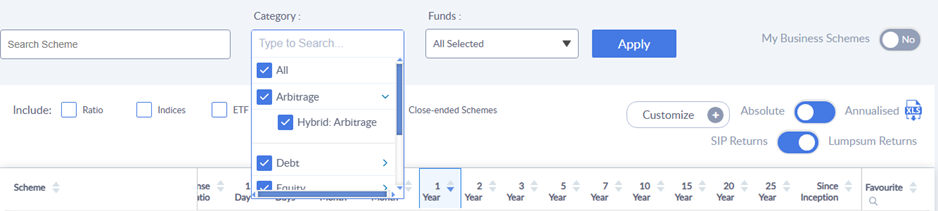
The main categories are Arbitrage, Debt, Equity, Hybrid, Liquid and Ultra Short, and Other.
Filter by fund house
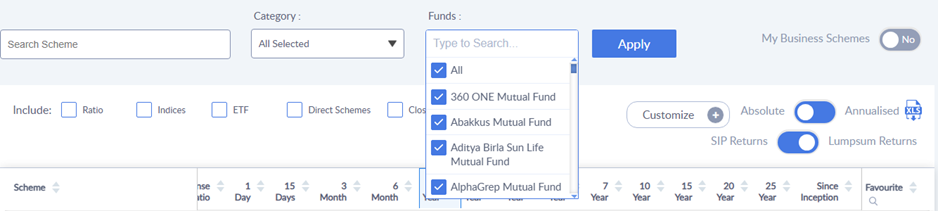
- Click the Funds dropdown. All fund houses are ticked by default.
- Untick All and tick the fund houses you want, or type a name in the search box to find one.
- Click Apply.
4. How to view and sort returns
Sort the table
The column header with the highlighted arrow is the column the table is sorted by. By default the table is sorted by 1 Year returns, with the highest first. Click the arrows on any other column header, such as 3 Year or 5 Year, to sort by that column.
Add shorter return periods
- Click Customize.
- Tick the periods you want: 1 Day, 7 Days, 15 Days, 30 Days or 3 Month.
- Click X to close the box. The selected periods appear as columns in the table.
Absolute or Annualised returns
Use the Absolute / Annualised switch to choose how returns for periods of up to 1 year are shown. Returns for periods longer than 1 year are shown as annual (CAGR) returns.
SIP or Lumpsum returns
Use the SIP Returns / Lumpsum Returns switch to change the type of returns shown. The page opens with Lumpsum Returns. In the SIP view, the table shows 1 Year, 3 Year, 5 Year, 10 Year, 15 Year and 20 Year returns and Since Inception.
5. Favourites and Excel download
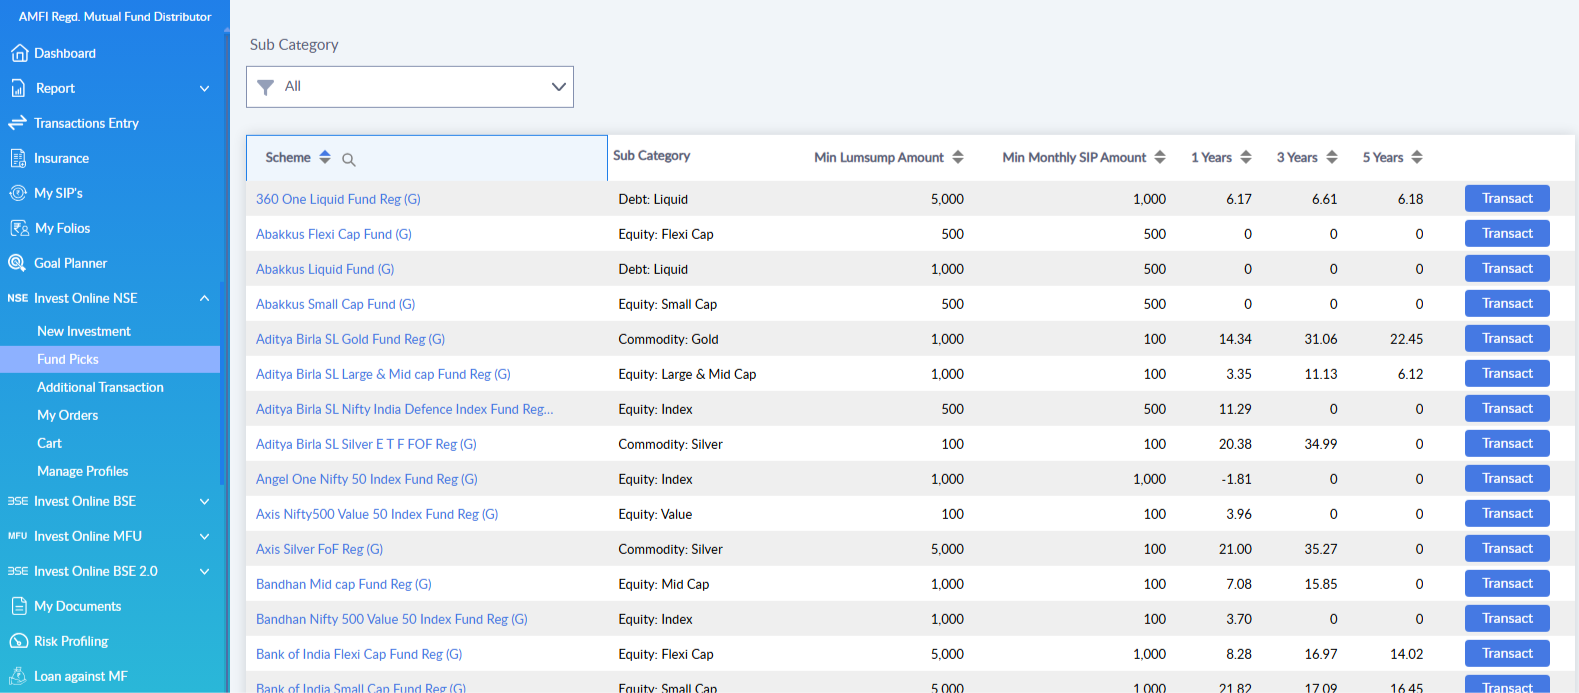
- Favourite: click the heart icon at the end of a scheme's row to add it to your favourites. A red heart means the scheme is a favourite. Click it again to remove it. The schemes which are marked as favourite by the broker users, will be visible to clients under Fund Picks of each exchange enabled by the broker for the client, they will also be visible on app dashboard when the client logs in to their mobile app.
- Download to Excel: click the Excel (XLS) icon beside the Absolute / Annualised switch.
6. Open a scheme's factsheet
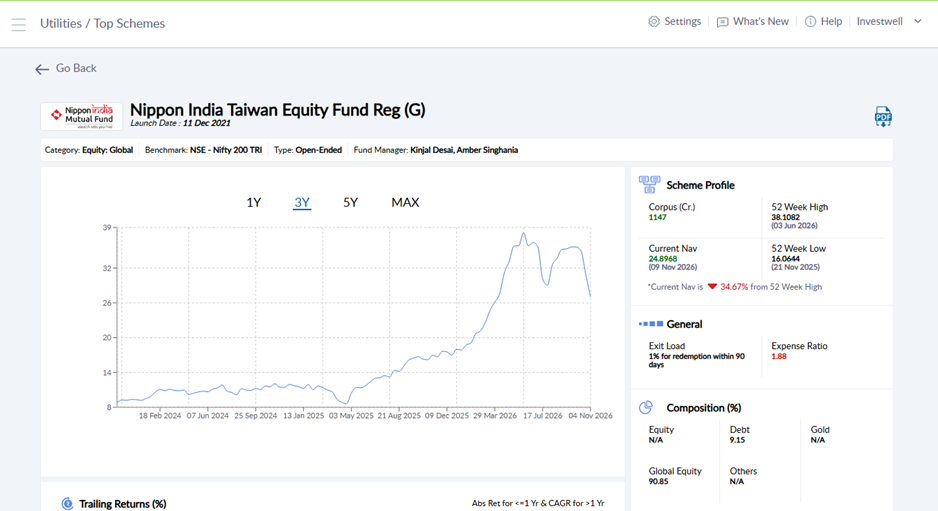
Scheme names are clickable. Scheme names appear in blue in the Scheme column. Click a scheme name to open that scheme's factsheet, which shows detailed information about the scheme. Click Go Back at the top of the factsheet to return to the list.
Scheme details
- Scheme header: the fund house logo, scheme name, launch date, category, benchmark, type (for example Open-Ended) and fund manager. A PDF icon appears at the top right of the factsheet.
- NAV chart: the scheme's NAV over time. Use 1Y, 3Y, 5Y or MAX to change the period shown.
- Scheme Profile: corpus (Cr.), current NAV, 52 week high and 52 week low, and how far the current NAV is from the 52 week high.
- General: exit load and expense ratio.
- Composition (%): how the scheme is invested, for example Equity, Debt, Gold, Global Equity and Others.
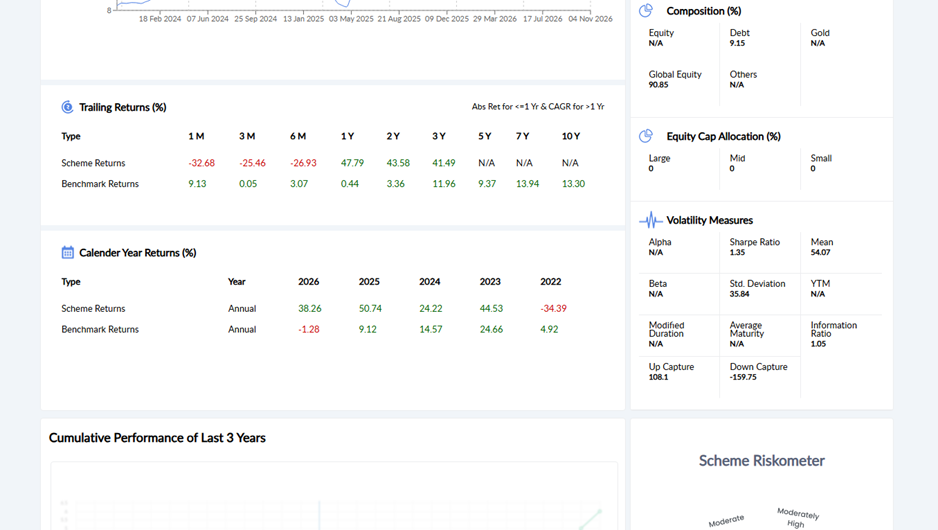
- Trailing Returns (%): scheme returns and benchmark returns for 1 month up to 10 years. Returns up to 1 year are absolute, and returns for more than 1 year are CAGR.
- Calendar Year Returns (%): scheme returns and benchmark returns for each calendar year.
- Equity Cap Allocation (%): the split between Large, Mid and Small cap.
- Volatility Measures: Alpha, Beta, Sharpe Ratio, Mean, Standard Deviation, YTM, Modified Duration, Average Maturity, Information Ratio, Up Capture and Down Capture. A value shows N/A when it does not apply to the scheme.
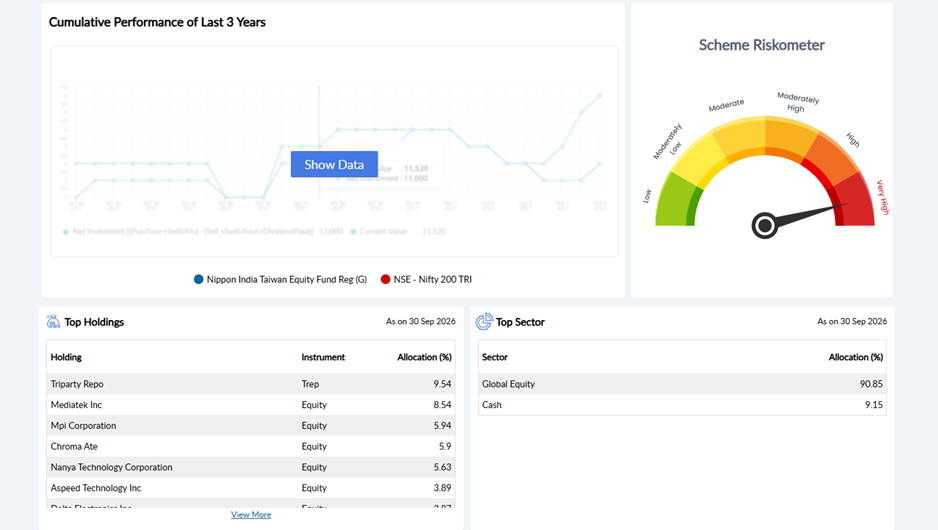
- Cumulative Performance of Last 3 Years: a chart comparing the scheme with its benchmark. Click Show Data to load the chart.
- Scheme Riskometer: shows the risk level of the scheme, from Low to Very High.
- Top Holdings and Top Sector: the largest holdings and sectors with their allocation, with the date they are as on. Click View More to see the full list.
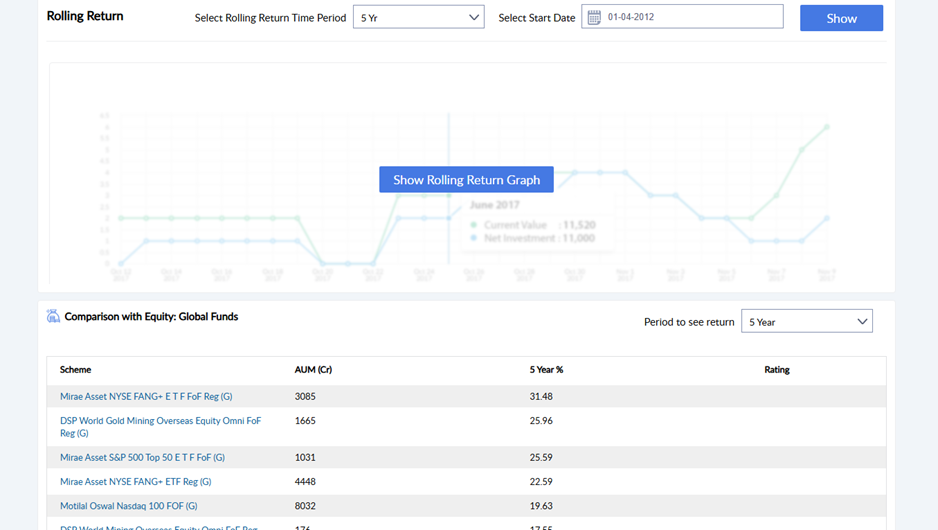
- Rolling Return: choose a rolling return time period and a start date, click Show, and then click Show Rolling Return Graph.
- Comparison with the category: compares the scheme with other schemes in the same category (for example Equity: Global Funds) on AUM and returns. Use Period to see return to change the period. The scheme names in this table are also clickable.
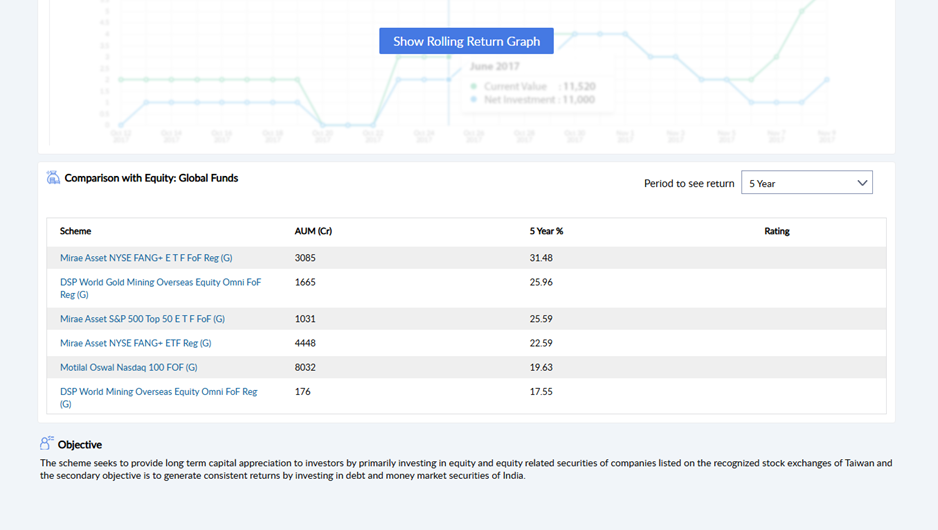
- Objective: the scheme's investment objective.
7. Tips
- To find the best performers for a period, sort the table by that period's column.
- To compare schemes of one type, filter by Category (and by Funds if needed), click Apply and then sort by returns.
- Mark schemes you often recommend as favourites so that you can find them quickly and refer them to the clients/ investors under fund picks section.
- Open the factsheet before recommending a scheme, to check its risk level, holdings, expense ratio and exit load.
- If a scheme or a type of scheme is missing from the list, check the Include options, the Category and Funds filters, and the My Business Schemes switch.
8. Frequently asked questions
Q1. How do I open Top Schemes?
Click Utilities in the left menu and then click Top Schemes.
Q2. How do I find a particular scheme?
Type its name in Search Scheme and click Apply.
Q3. How do I see only equity or only debt schemes?
Open the Category dropdown, untick All, tick the category you want and click Apply.
Q4. How do I see schemes of one fund house?
Open the Funds dropdown, untick All, tick the fund house and click Apply.
Q5. How do I see the details of a scheme?
Click the scheme name in the Scheme column. The name is a clickable link that opens the scheme's factsheet.
Q6. How do I see 1 day, 7 day, 15 day, 30 day or 3 month returns?
Click Customize and tick the periods you want. They are added as columns in the table.
Q7. How do I see the best performing schemes for a period?
Click the arrows on that period's column header to sort the table. By default the table is sorted by 1 Year returns.
Q8. How do I see SIP returns instead of lumpsum returns?
Use the SIP Returns / Lumpsum Returns switch above the table.
Q9. What is the difference between Absolute and Annualised?
It changes how returns for periods of up to 1 year are shown. Returns for periods longer than 1 year are always shown as annual (CAGR) returns.
Q10. How do I mark a scheme as a favourite?
Click the heart icon at the end of the scheme's row. A red heart means it is a favourite.
Q11. Why are some return columns blank or showing a dash?
A dash means there is no return to show for that period, for example because the scheme was launched later than that period.
Q12. Why can't I find a scheme in the list?
Check the Include options (Ratio, Indices, ETF, Direct Schemes, Close-ended Schemes), the Category and Funds filters, and the My Business Schemes switch. Direct and close-ended schemes are shown only when you tick them.
Q13. Can I download the list to Excel?
Yes. Click the Excel (XLS) icon beside the Absolute / Annualised switch.
Still need help? Contact the Investwell support team by raising a ticket.
Was this article helpful?
That’s Great!
Thank you for your feedback
Sorry! We couldn't be helpful
Thank you for your feedback
Feedback sent
We appreciate your effort and will try to fix the article